How sales are detected
Every few hours we check every store on BrickLink to see which ones have a sale running. We pick up sales that have just started, and we also track any change to a sale that started earlier, so you can see how it has moved since.
You'll find the tool under Store discounts in the Tools menu. By default the sales that have just changed appear first, so the top of the list is always the freshest activity.
BrickLink applies discounts per lot, not per store. That means one store often runs several different rates at the same time: five percent on some lots, fifteen on others, thirty on a handful. It's the reason a single headline number never tells you the whole story, and why the breakdown further down this page matters.
Narrowing down to the sales you care about
There are always sales running somewhere. The filters at the top of the table are what turn that noise into a shortlist:
- Country: show every country, or just your own if you would rather buy locally and keep shipping short and cheap.
- Item type: by default you see sales on anything. If you only buy minifigures, keep the stores that have actually discounted their minifigures rather than the ones running a sale on instructions.
- Ships to: when your BrickLink store is connected, we know which country you are in and show only the stores that will ship to you. It's on by default, and you can turn it off whenever you want the full picture.
- Store name: a plain text search, for when you are looking for one store in particular.
Below those you get range filters on the typical discount, the deepest discount, the number of lots on sale and the coverage. They work exactly like the range filters everywhere else in BL Metrics, so a minimum, a maximum, or both. See the Tables tips and tricks guide if you want the detail.
Reading the table
Each row is one store with a sale running. Next to the name you get a short description of what the sale actually is, which item types are discounted and by how much, and if the sale has changed since it started, what it looked like before.
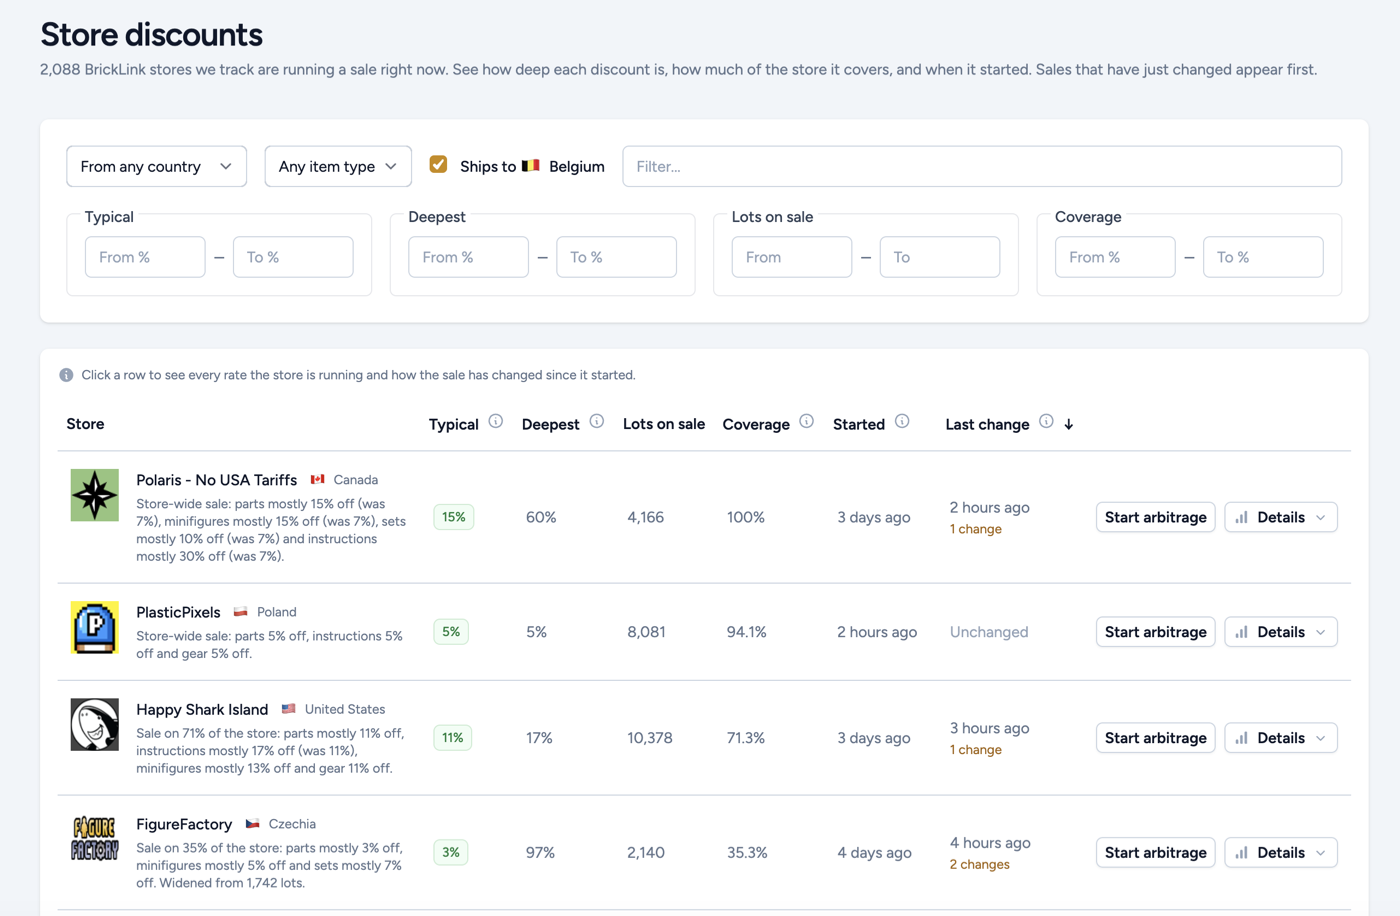
Then come the numbers:
- Typical: the rate applied to the most lots, so the discount you are most likely to run into. This is the number to judge a sale on.
- Deepest: the single biggest discount in the store. Worth knowing, but it may apply to exactly one lot, so never judge a sale on this alone.
- Lots on sale: how many lots are discounted.
- Coverage: what share of the store's lots that represents. Ninety percent coverage is a store-wide sale. Five percent is a handful of items put on offer.
- Started: when we first saw the sale.
- Last change: when the seller last altered it, or Unchanged if nothing has moved since it started.
Pay attention to Started. A sale that has been running for several days has usually been picked over already, and the obvious bargains will be gone. The sales worth your time are generally the ones you catch early.
A change is something the seller did: raising or lowering a rate, adding an item type that wasn't discounted before, or extending the sale to more lots. Lots simply selling out does not count as a change.
Looking at a sale in detail
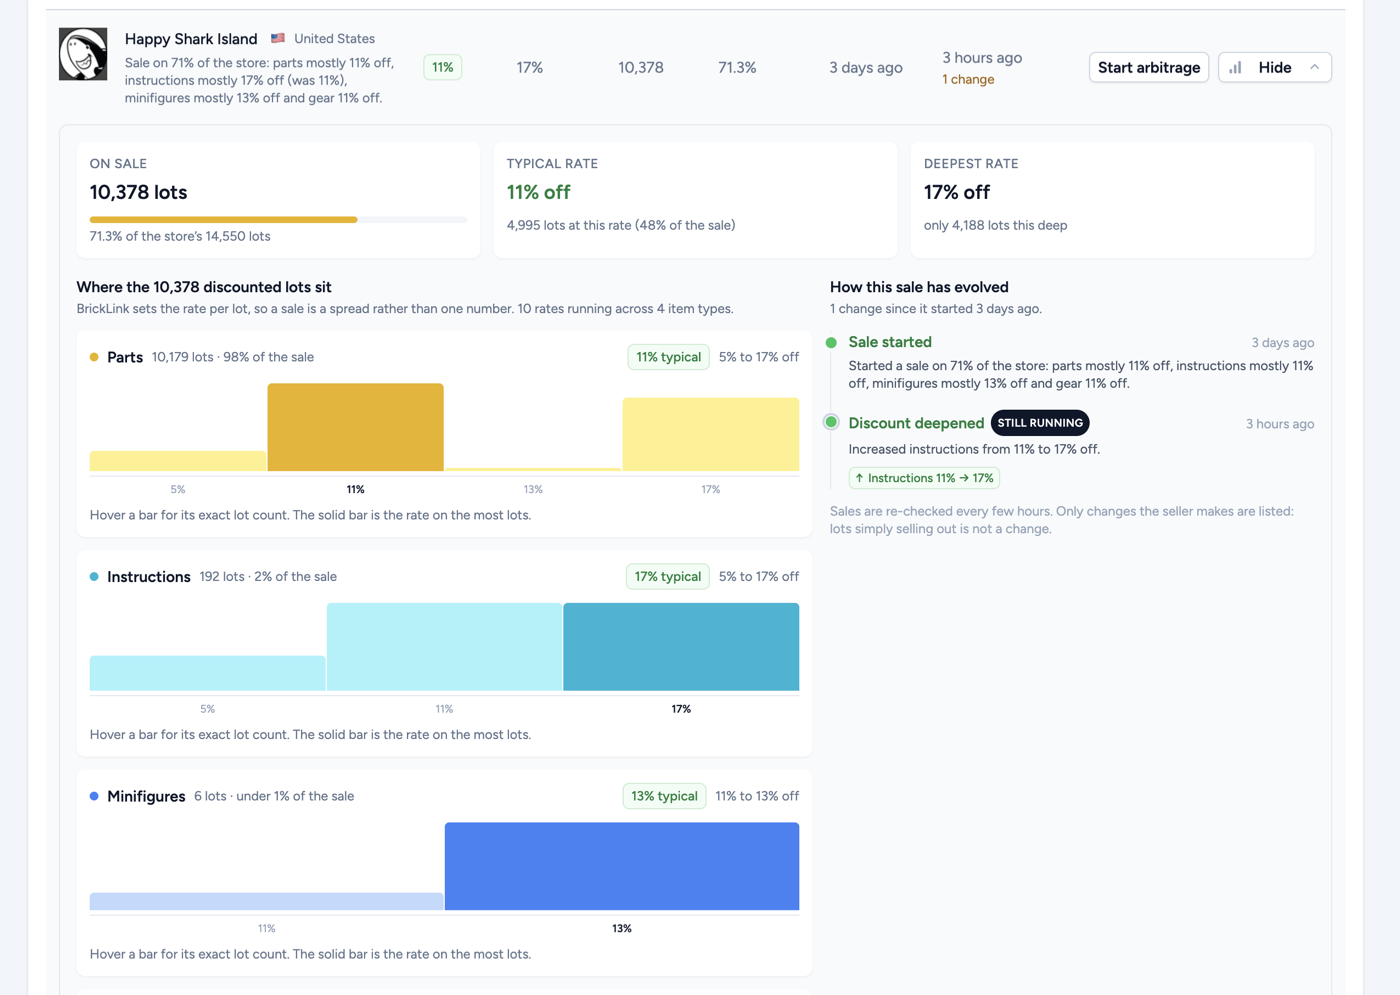
Click any row to open the full detail of the sale. Three cards summarise it: how many lots are on sale and what share of the store that is, the typical rate along with how many lots run at it, and the deepest rate with how many lots actually go that deep. That last figure is the one that stops a headline number from misleading you.
Below that, the discounted lots are broken down by item type, each with its own typical rate and the full range it spans. Every item type gets a chart showing how its lots are spread across the different rates, and you can hover any bar for the exact lot count. The solid bar is the rate applied to the most lots.
This is where the real picture comes out. A sale might be eleven percent off on five thousand lots, but with a tail at five percent and another at seventeen. Read as one number it looks unremarkable. Broken down, you can see exactly where the value sits.
How this sale has evolved
Alongside the breakdown you get the history of the sale, from the day it started through every change the seller has made since, with the latest one marked as still running. The direction of travel tells you a lot:
- A sale getting deeper, or spreading to more item types, is a seller pushing harder to move stock. Usually worth a look.
- A sale getting shallower, say parts going from twenty percent down to three, is a seller winding it down. The good buying window has probably passed.
Acting on a sale
Once a store looks promising, you have two ways in:
- Click the store name to open its full page, with the complete inventory analysis. The right move when you want to understand a store before committing to it.
- Click Start arbitrage to jump straight into the manual arbitrage tool with that store already selected. Set your markup, run it, and you'll see immediately whether there is anything worth buying at those prices.
The Store arbitrage guide covers what happens next in full.
Summary
A discount is only an opportunity if the discounted lots are things you can resell at a profit, and if you get there before everyone else. Store discounts gives you both halves of that: filter down to the sales that fit how you buy, check the breakdown rather than the headline rate, and go straight into arbitrage from the store that looks best.