Automatic or manual syncing
BL Metrics gives you powerful tools to explore and analyze your BrickLink store inventory. To get started, you'll need to import your inventory, either by connecting your store via the BrickLink API, or by uploading it manually.
If you've connected your store using the API, your inventory will refresh automatically every 4 hours. You can also trigger a manual refresh at any time, for example right after uploading new parts to your store.
If you haven't connected the API, you can still import your inventory manually by uploading your BrickLink inventory file. Just export your inventory as an XML from BrickLink and upload it to BL Metrics. It's quick, but having it automated is even easier.
Browsing your inventory
Once your inventory is loaded, you'll see the familiar BL Metrics table layout, with rich pricing data for every part and minifigure in your store. You can customize the view to fit your needs and gain insights into your current stock.
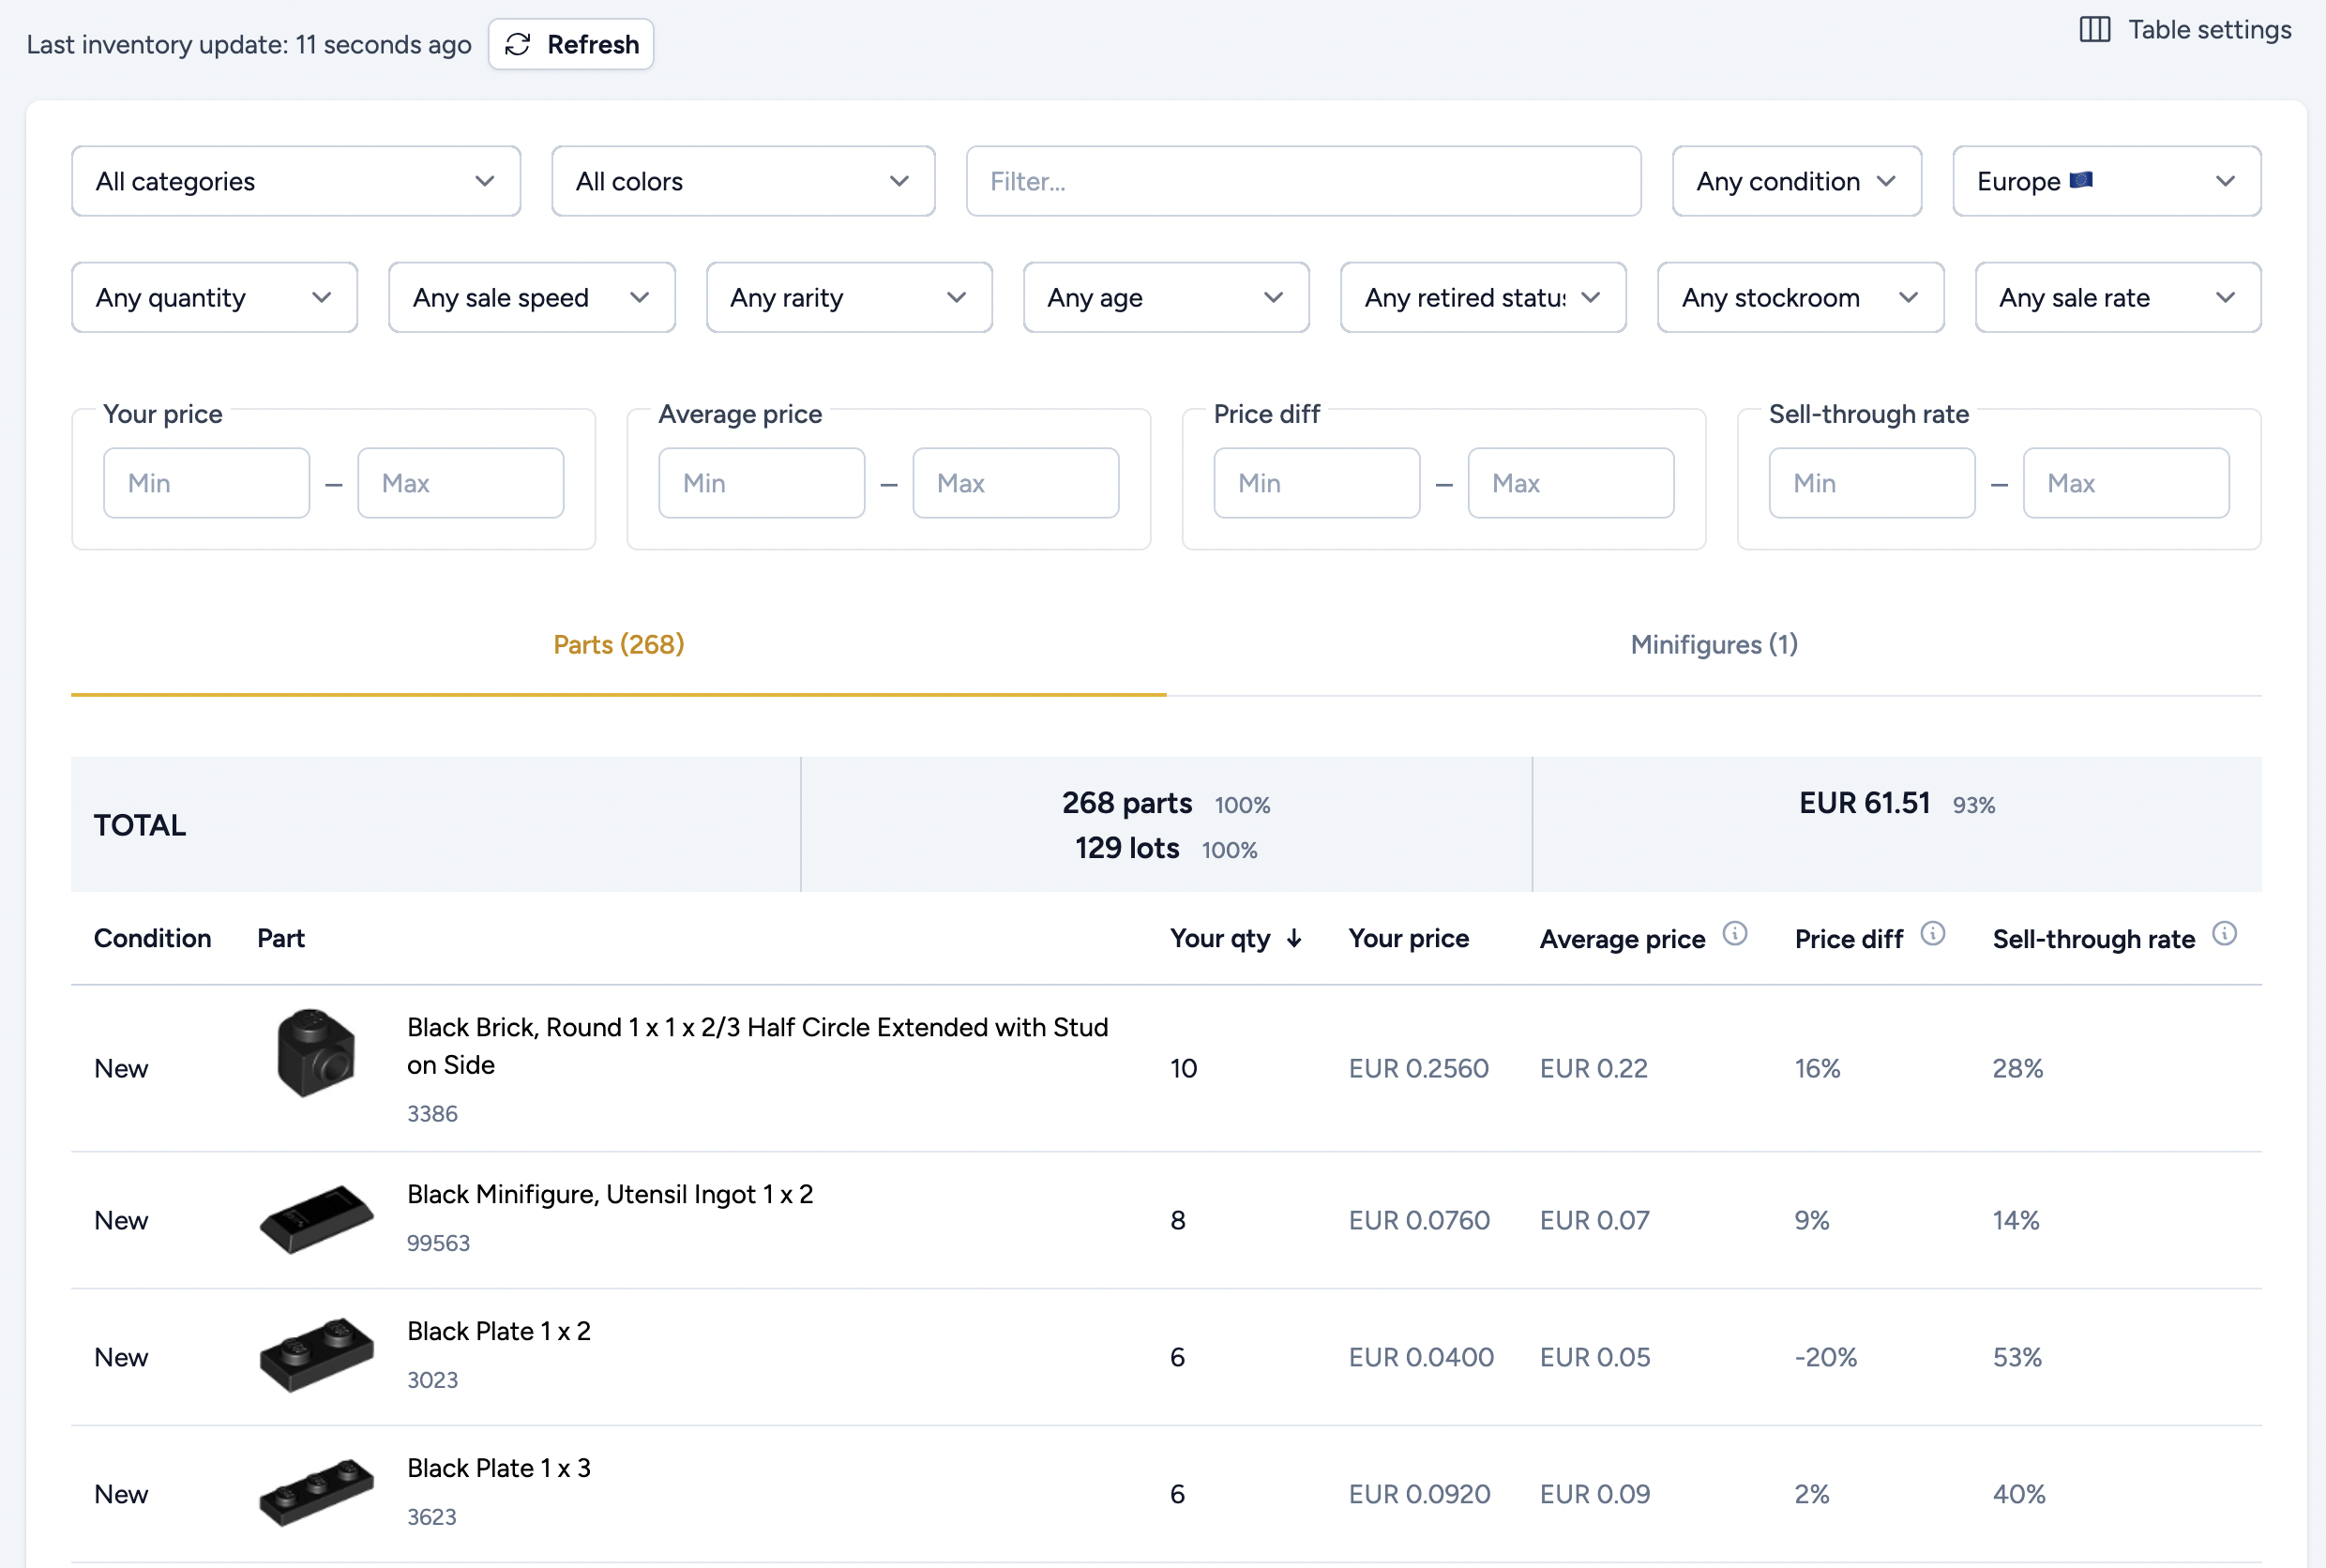
Click on the Table settings at the top right to configure the data to be shown on the table.
You can also filter and sort on various data points, like sell-through rate, average price, smart price difference, and more, to identify items that might need a price adjustment or are worth restocking.
Inventory summary
At the top of the inventory table, you'll find a dynamic summary block that reflects the current filtered view. This block helps you quickly understand how a subset of your inventory contributes to your store as a whole.
By combining filters with the summary view, you can better understand what drives your sales, what slows you down, and how to prioritize future purchases or pricing adjustments.

1. Quantity and Lot Count (left column)
Highlighted in red in the screenshot is the total number of parts and lots that match your current filters. In this example, the filter "High Quantity" was applied, which means we're only looking at the top 10% of parts with the highest quantity sold in the selected region.
We can see that your inventory has 220 parts across 92 lots that meet the "High Quantity" criteria. This example focuses on the parts table, so minifigures are not included. If you switch to the minifigures tab, you'll see the same type of summary applied to filtered minifigures, showing how many match your current view.
Highlighted in green is the percentage of filtered items compared to the full inventory. In this case, the 220 parts represent 87% of the total number of parts in your store (excluding minifigs), and 80% of the lots.
2. Value Overview (right column)
The second column focuses on value, based on your store prices. In this example, the filtered parts are worth €22.37 (highlighted in red).
In green, you'll see the percentage of total value these filtered items represent. Here, the "High Quantity" parts account for 44% of the total store value, which includes minifigures.
3. Why it matters
This summary is extremely useful when combined with filters. It allows you to quickly answer questions like:
- What percentage of my inventory value is in minifigures or in specific types of parts?
- What percentage of the parts are fast sellers or slow sellers?
- How many newly released (less than 6 months old) do I have in my inventory?
And much more. The summary gives you a clear picture of what's in your store.
Conclusion
The inventory view is more than just a list, it's a powerful analysis tool. Whether you're looking to optimize pricing, improve sell-through, or simply understand what's in your store, BL Metrics gives you the data and flexibility to make informed decisions, faster.