The Stores section in BL Metrics gives you a high-level view of every active BrickLink store, helping you understand their scale, pricing strategy, inventory type, and activity. Whether you're analyzing the market, checking out competitors, or looking for sourcing opportunities, this tool helps you compare stores with real, structured data.
Store List
The store list includes all active BrickLink stores, with detailed metrics that give you a better sense of their size, pricing strategy, and inventory composition. You can search, filter, and sort the list to focus on the types of stores that interest you most.
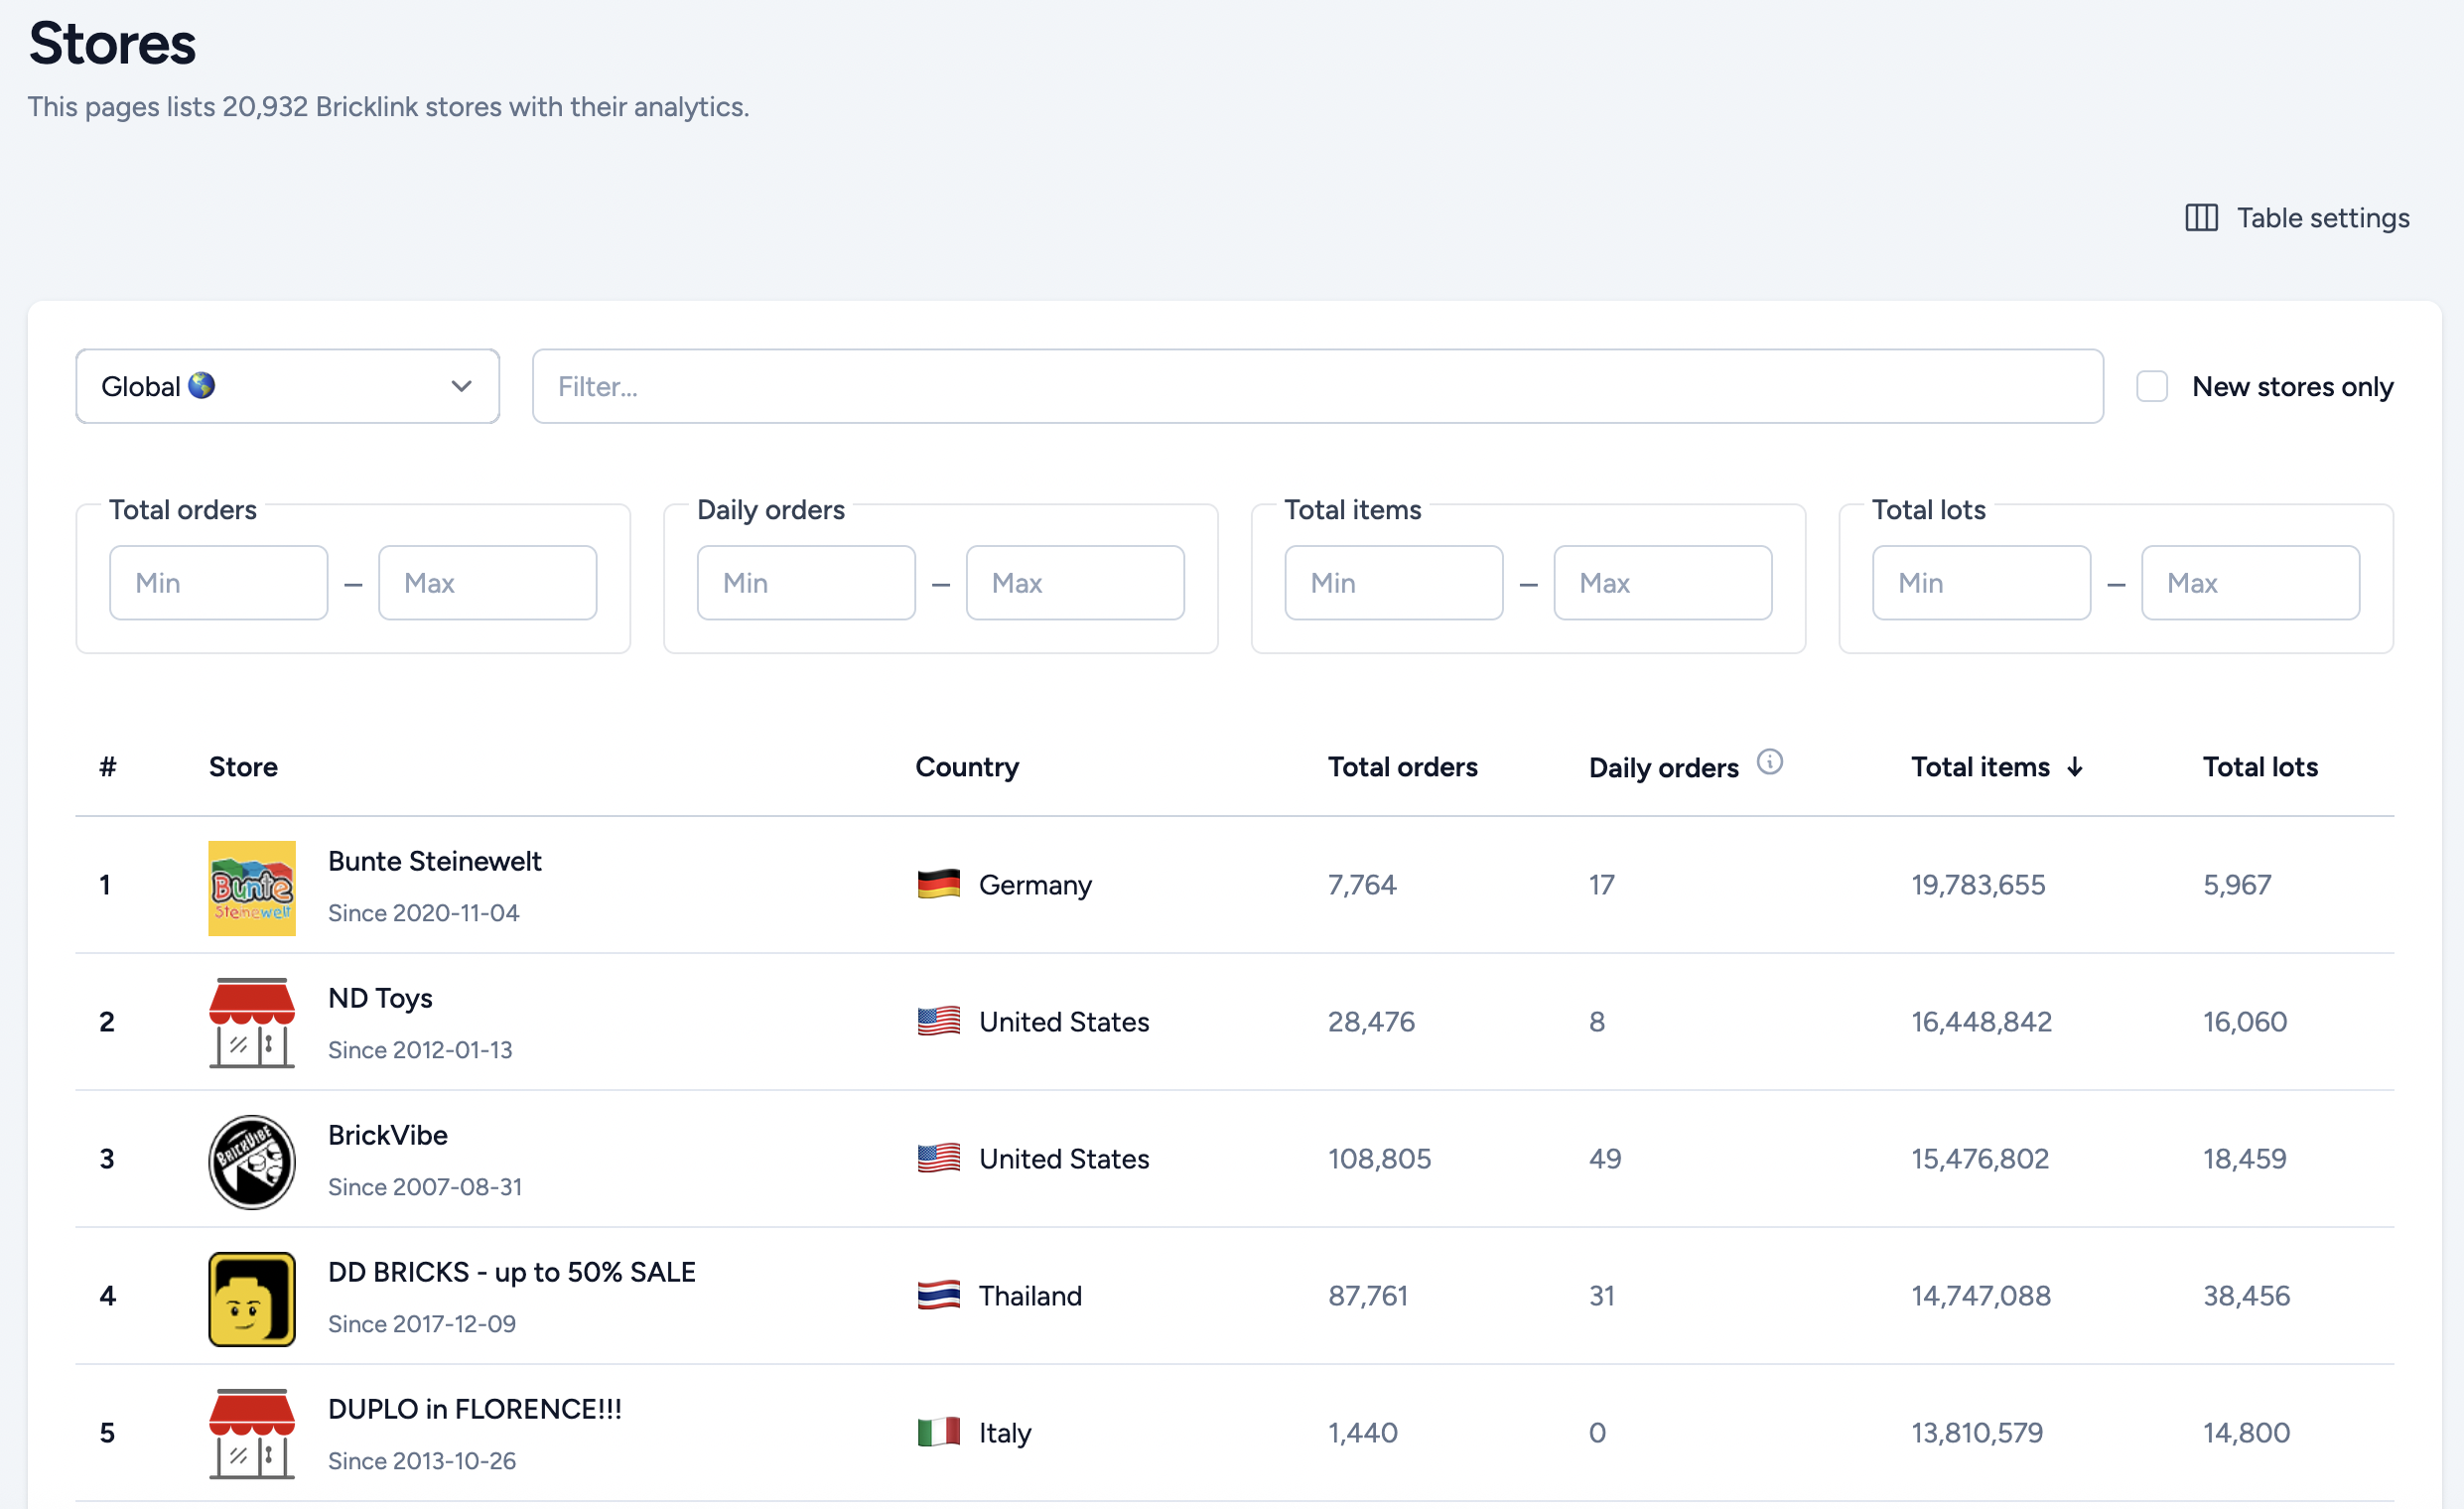
Click on the Table settings at the top right to configure the data to be shown on the table.
For each store, you can see:
- Store name and opening date
- Country of the store
- Total items, total lots, and total orders
- Daily orders: a 28-day average based on the most recent activity
- Unique lots: all listings of the same item are counted as one, regardless of condition or remarks (useful to assess actual variety)
- % of new items: based on item quantity (not number of lots)
- Average price difference: compared to the 6-month world average (parts and minifigs only)
- Inventory value (store prices): total value of parts and minifigs based on the store's own prices
- Inventory value (6-month average): total value of parts and minifigs using the 6-month worldwide average price
The inventory metrics, such as unique lots, % new items, ingentory value and average price difference are calculated approximately once a month, as they tend to remain relatively stable. They currently include only parts and minifigures. Other item types like sets, boxes, or instructions are excluded for now.
Store Details
Clicking on any store opens its detailed page. While you can't browse the full inventory directly, you can explore useful insights based on public data.
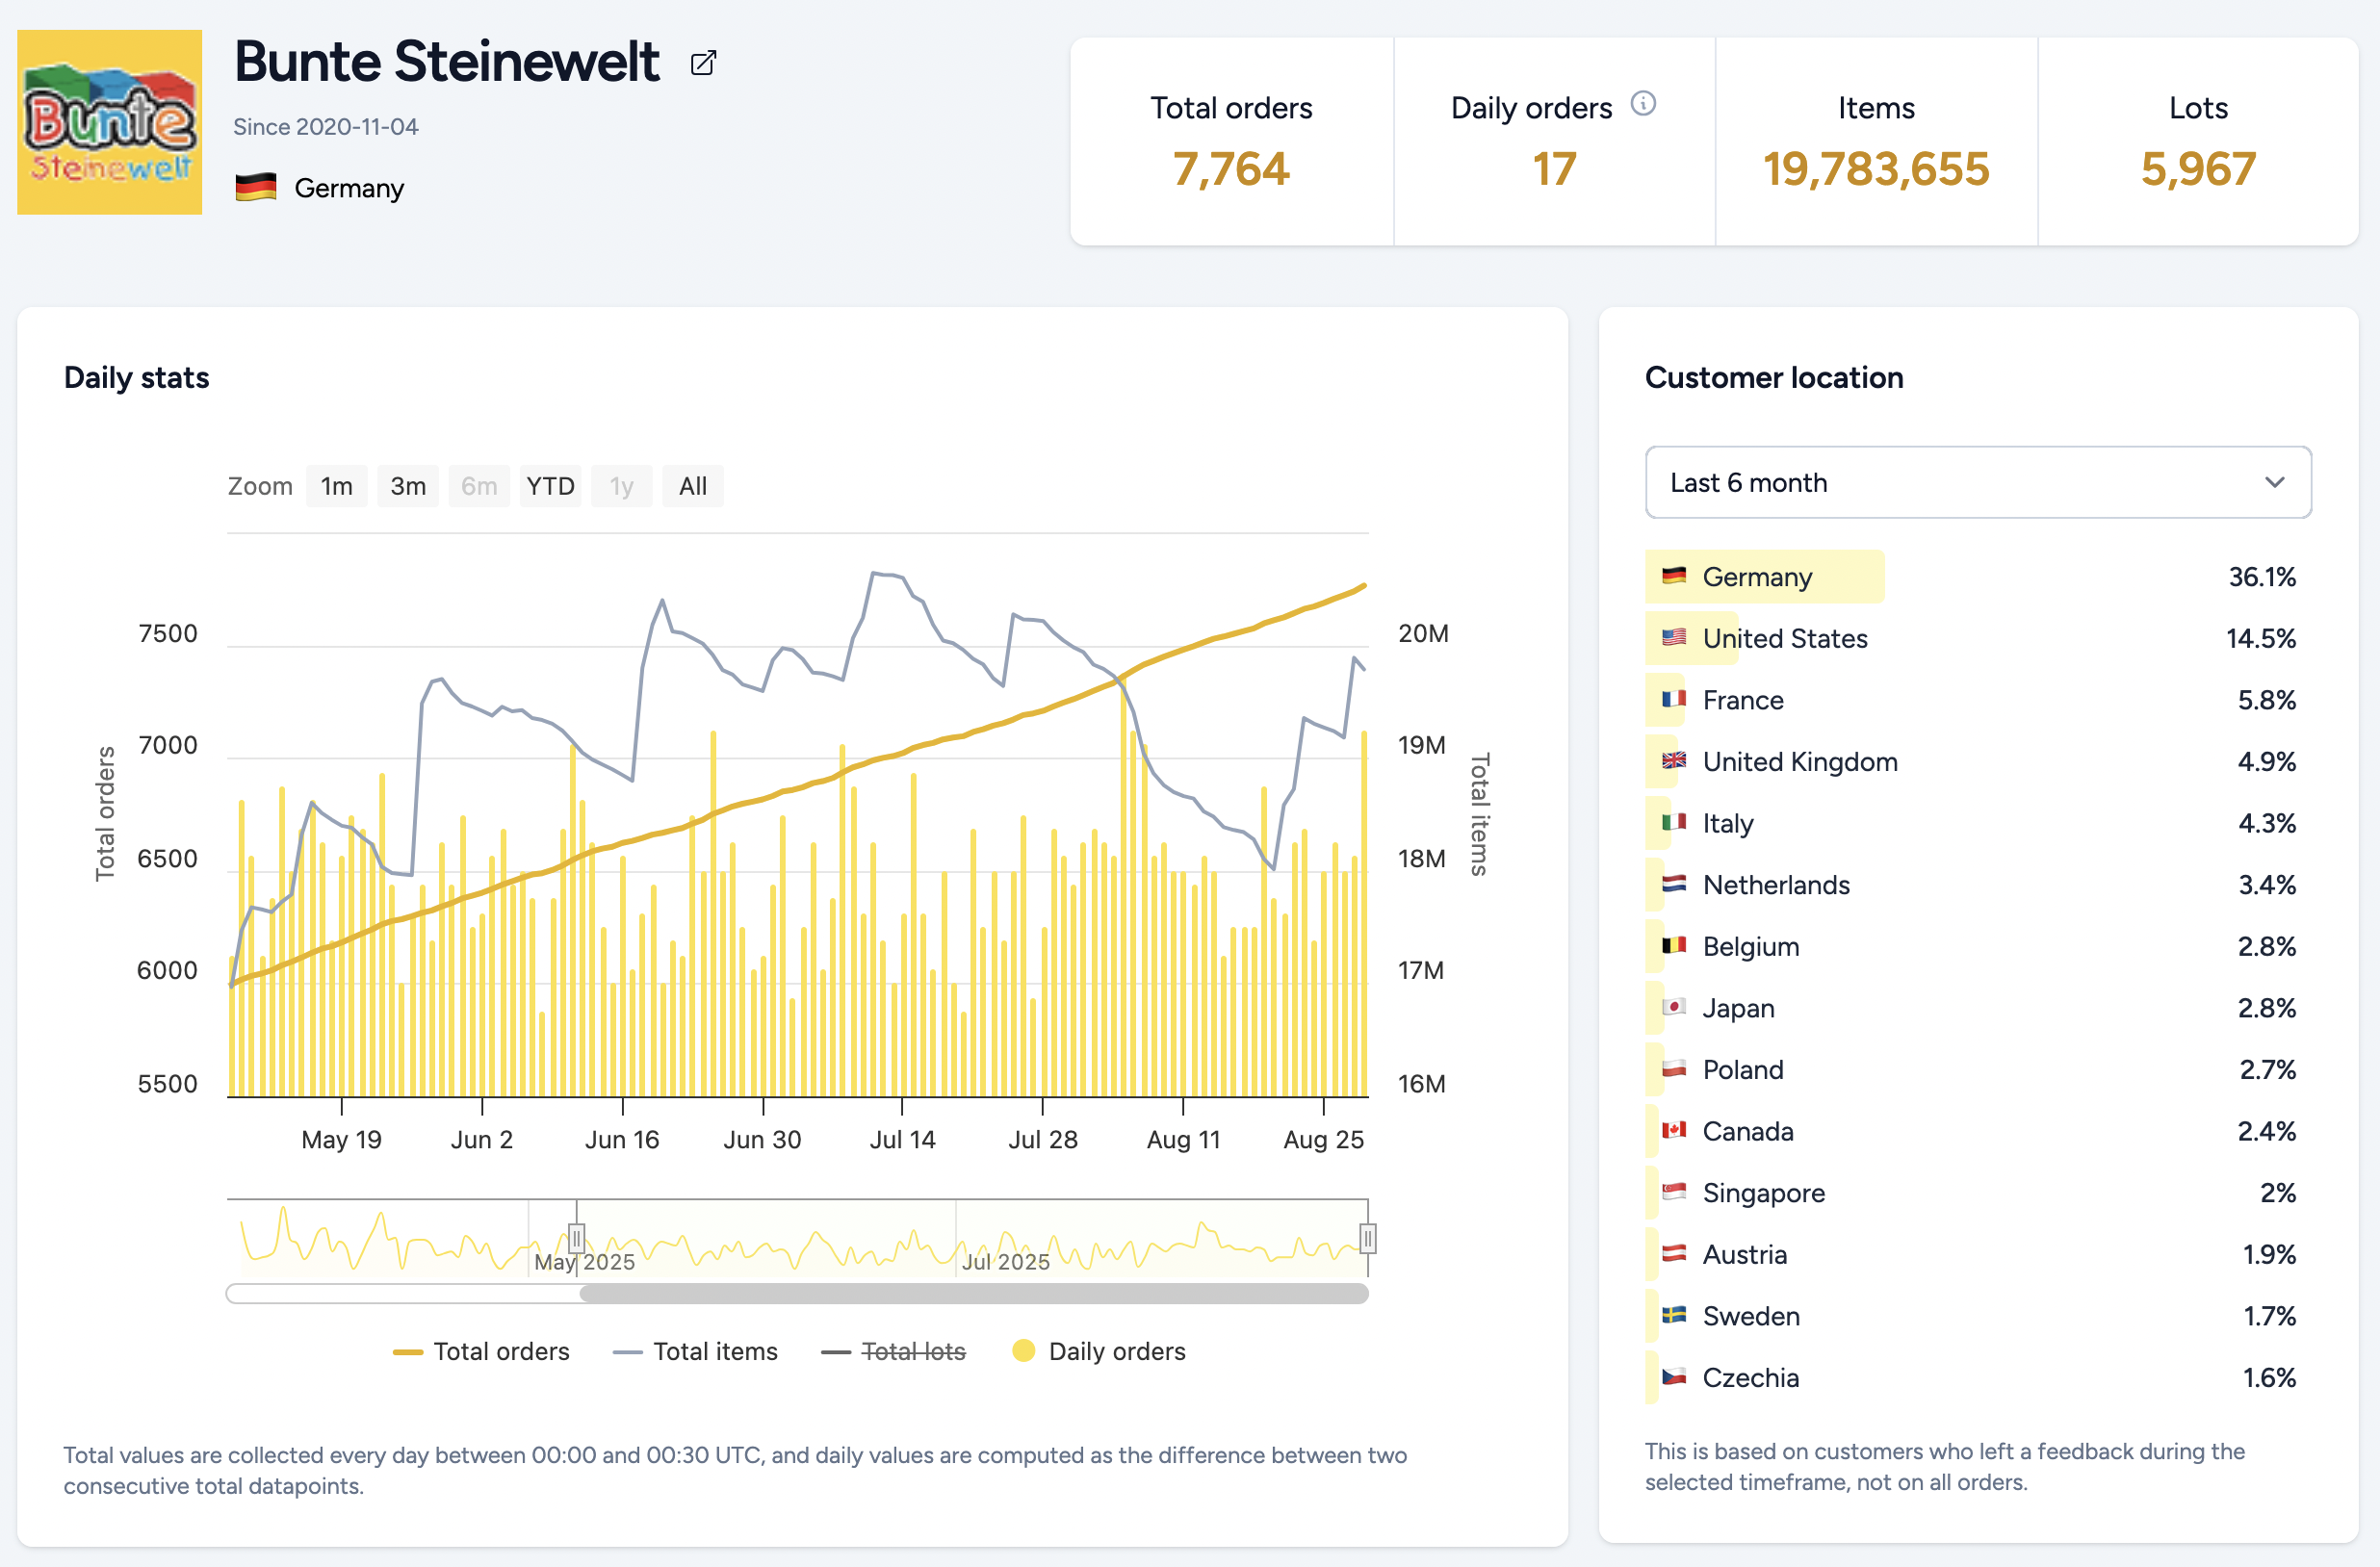
Daily Stats
A graph shows how the store's total items, total lots, and orders have changed day by day. This lets you track recent trends and activity , such as inventory growth or sudden drops in stock.
Customer Location
This section shows where the store's customers are located, based on user feedback data. While not every buyer leaves feedback, we estimate that around 40% do, so for larger stores, this provides a solid approximation of geographic demand.
Inventory Analysis
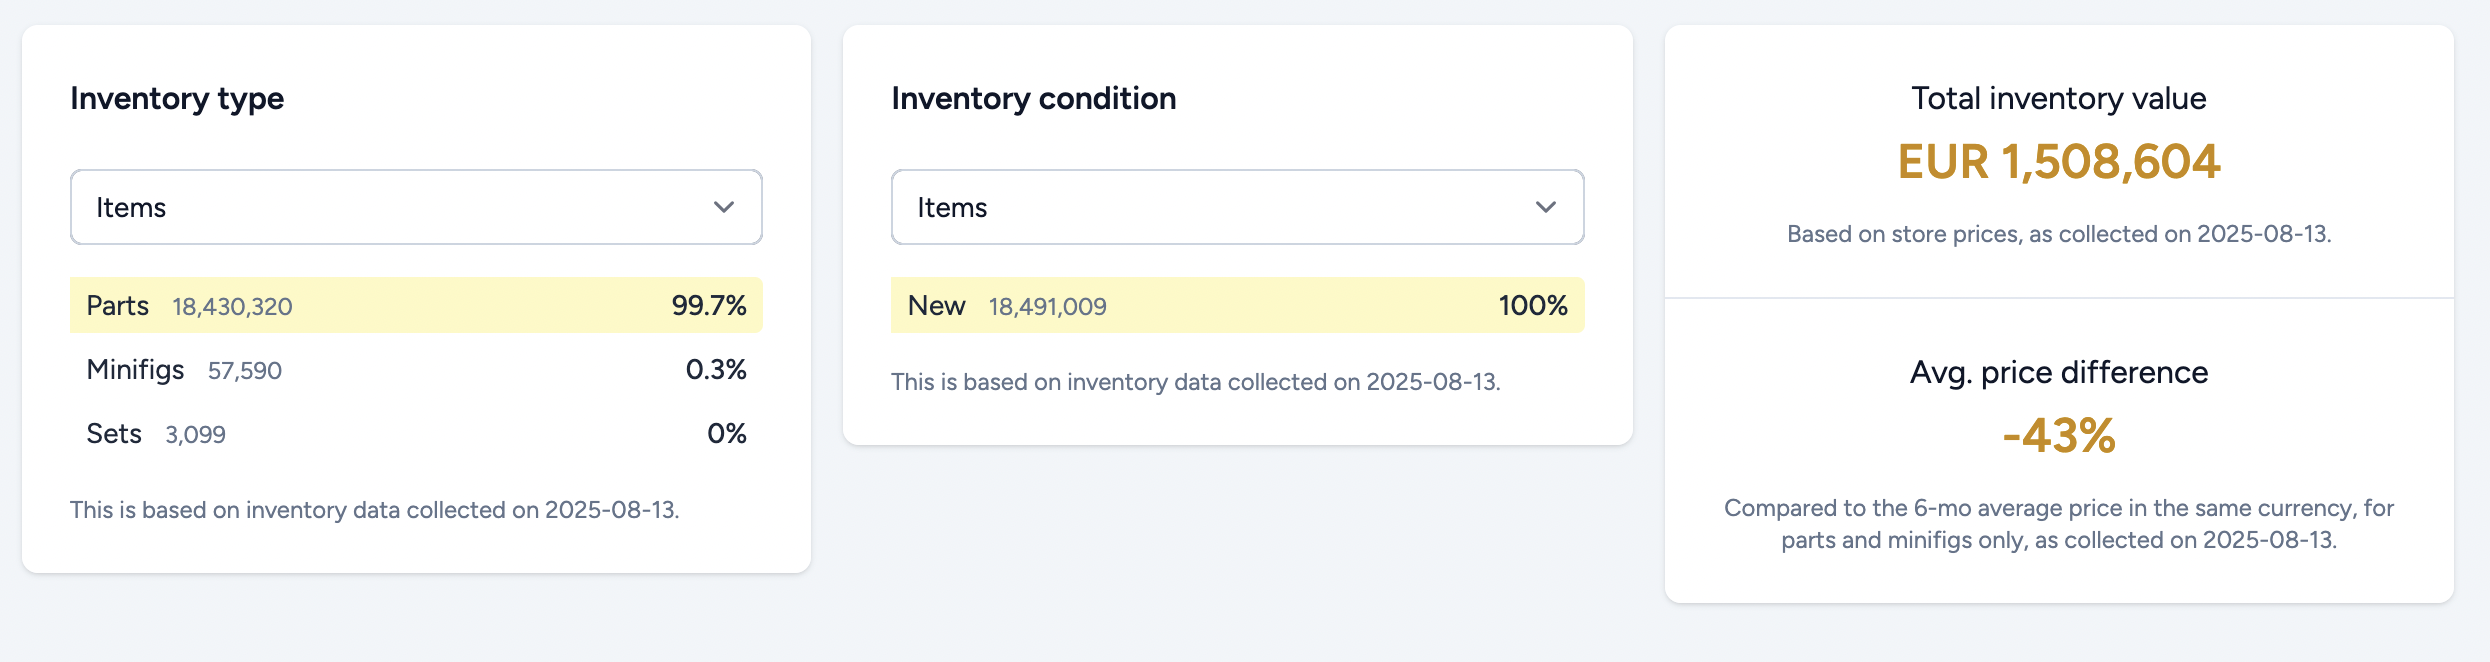
This breakdown shows how the store's inventory is distributed:
- Item type distribution: how much is made up of parts, minifigs, instructions, etc.
- Condition breakdown: percentage of new vs used items
- Inventory value (store prices): total value based on the store's own prices, in their local currency
- Average price difference: this compares the store's prices for parts and minifigs to the 6-month average in the region that uses the same currency (e.g. stores in EUR are compared to Europe region prices)
Note that this price comparison differs slightly from the one in the global store list, which is based on world averages and shown in USD.
Summary
The Stores module lets you explore and compare active BrickLink stores like never before. With insights into activity, pricing strategy, inventory structure, and regional footprint, you can better understand the competition, or uncover opportunities to buy, sell, or source smarter.