Set list
The Set List gives you access to all BrickLink sets, with powerful filters and sorting options to help you find the most promising candidates for part out.
By default, the list only shows sets that are currently available at retail, but you can enable filters to include retired sets as well.
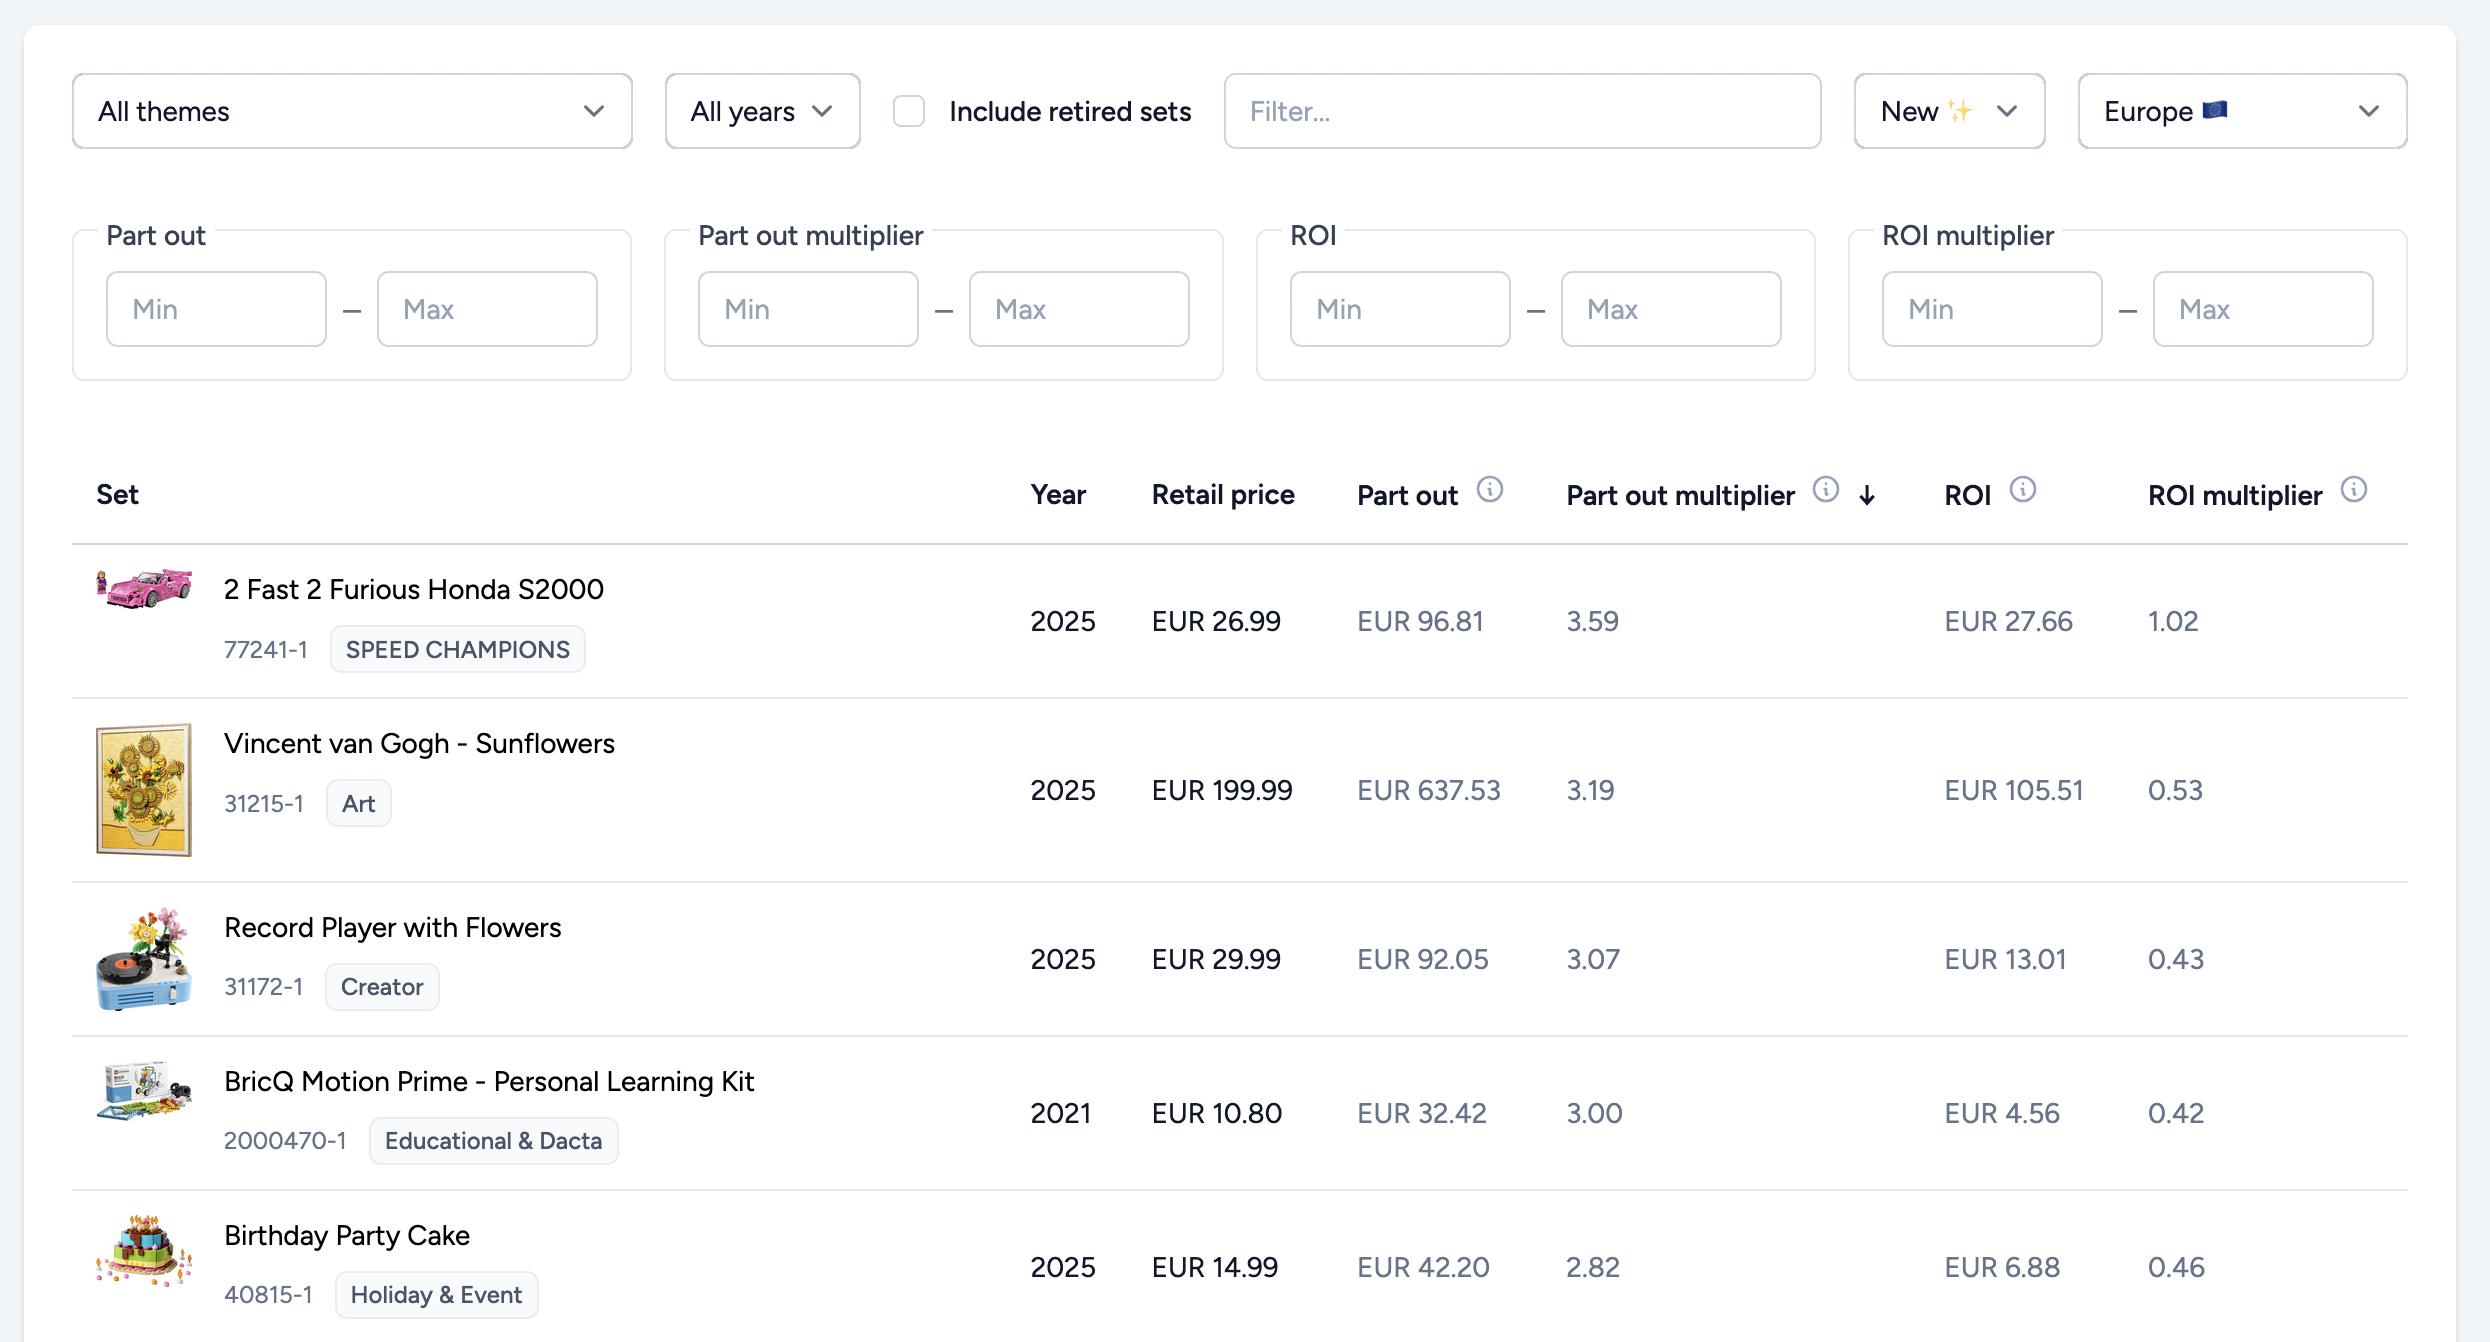
Click on the Table settings at the top right to configure the data to be shown on the table.
You can filter and sort sets by many useful fields, including:
- Theme, year, and set name
- Part Out Value and Part Out Multiplier
- ROI and ROI Multiplier
- Retail price (by region)
- Availability (retired or still in retail)
ROI stands for Return on Investment. In the context of BL Metrics, it represents the estimated value you can recover by selling the parts of a set. More specifically, the ROI shows how much of your investment you're likely to recover through sales within the first 6 months, based on real sales data from your selected region and condition (new or used). It takes into account which parts are likely to sell within 6 months (based on STR and demand), which parts may be hard to sell or slow-moving, and the actual selling prices in your region. This makes ROI a more realistic indicator of how profitable a set could be in practice, while the Part out value is more theorical.
All price and performance data is based on your selected region and condition (new or used), which you can change at any time. This makes it easy to spot which sets offer the best value in your market.
This view is ideal for shortlisting sets to part out but for deeper analysis, you can click into the set overview or inventory to see the full picture.
Set Overview
The overview page provides a detailed snapshot of the selected set, with all the key numbers you need to make a decision:
- Retail prices in all supported regions
- Part Out Value, calculated based on your region and condition
- ROI estimate and multipliers, based on your default or custom buying price
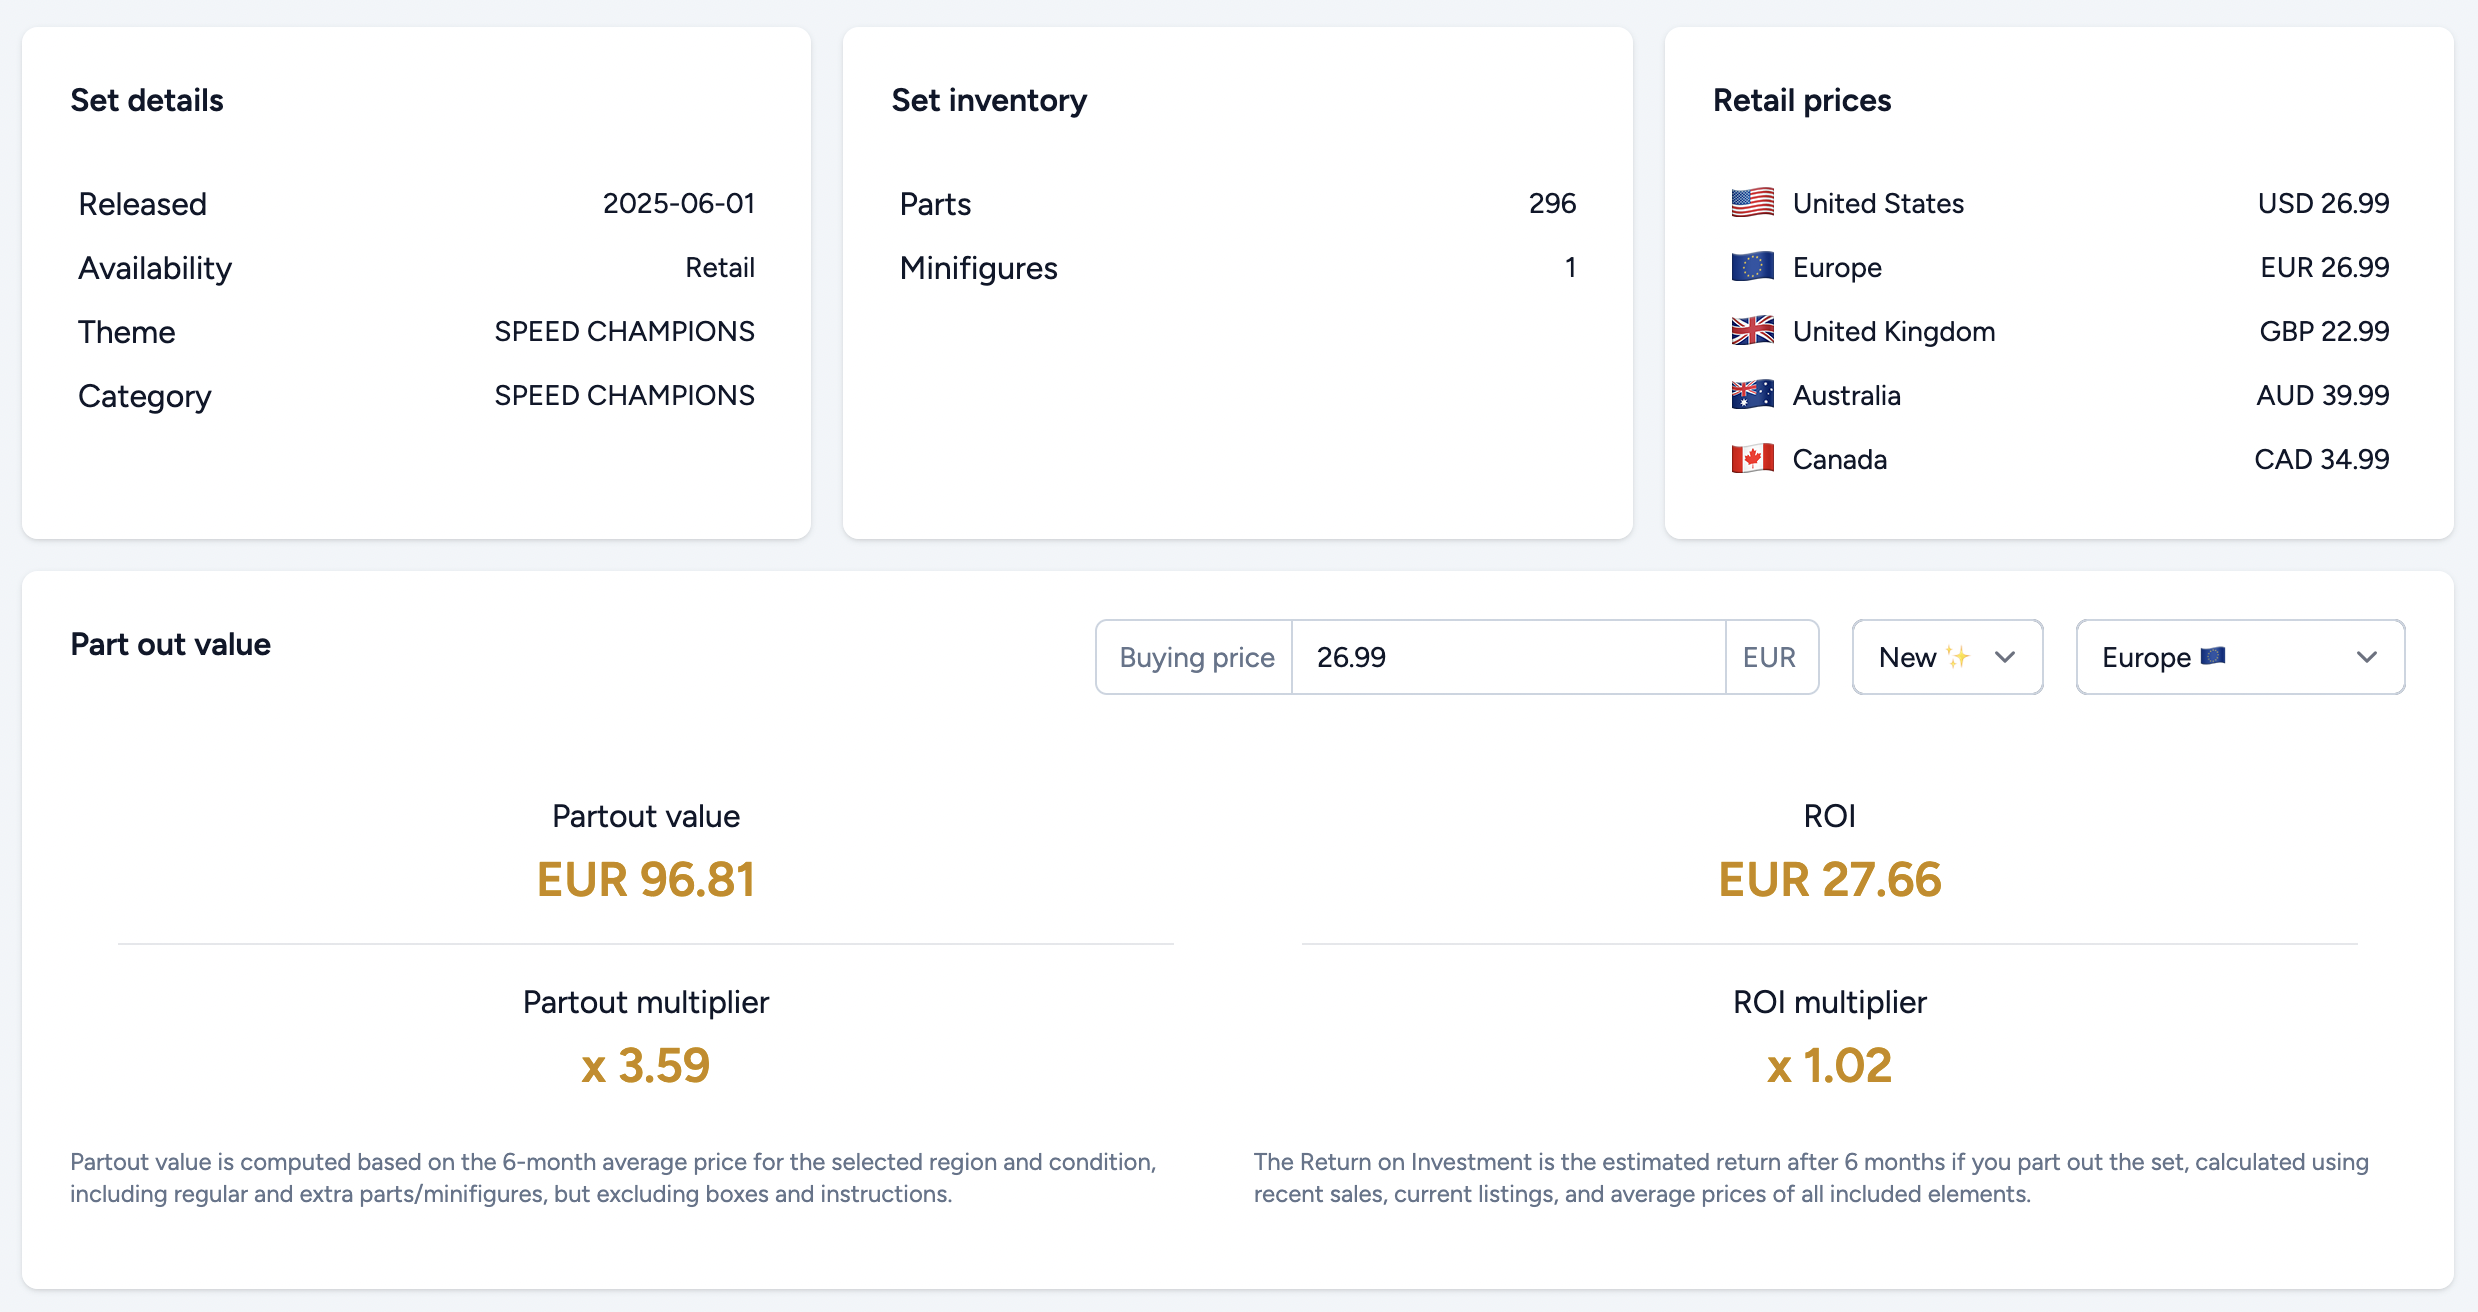
By default, the multipliers are calculated using the official retail price, but you can adjust this with your own purchase price to get a more realistic result, since most sellers don't pay full price when sourcing sets.
Both the Part Out Value and ROI calculation include extra parts and treat minifigures as whole units (they are not broken down into parts). Boxes and instructions are not included.
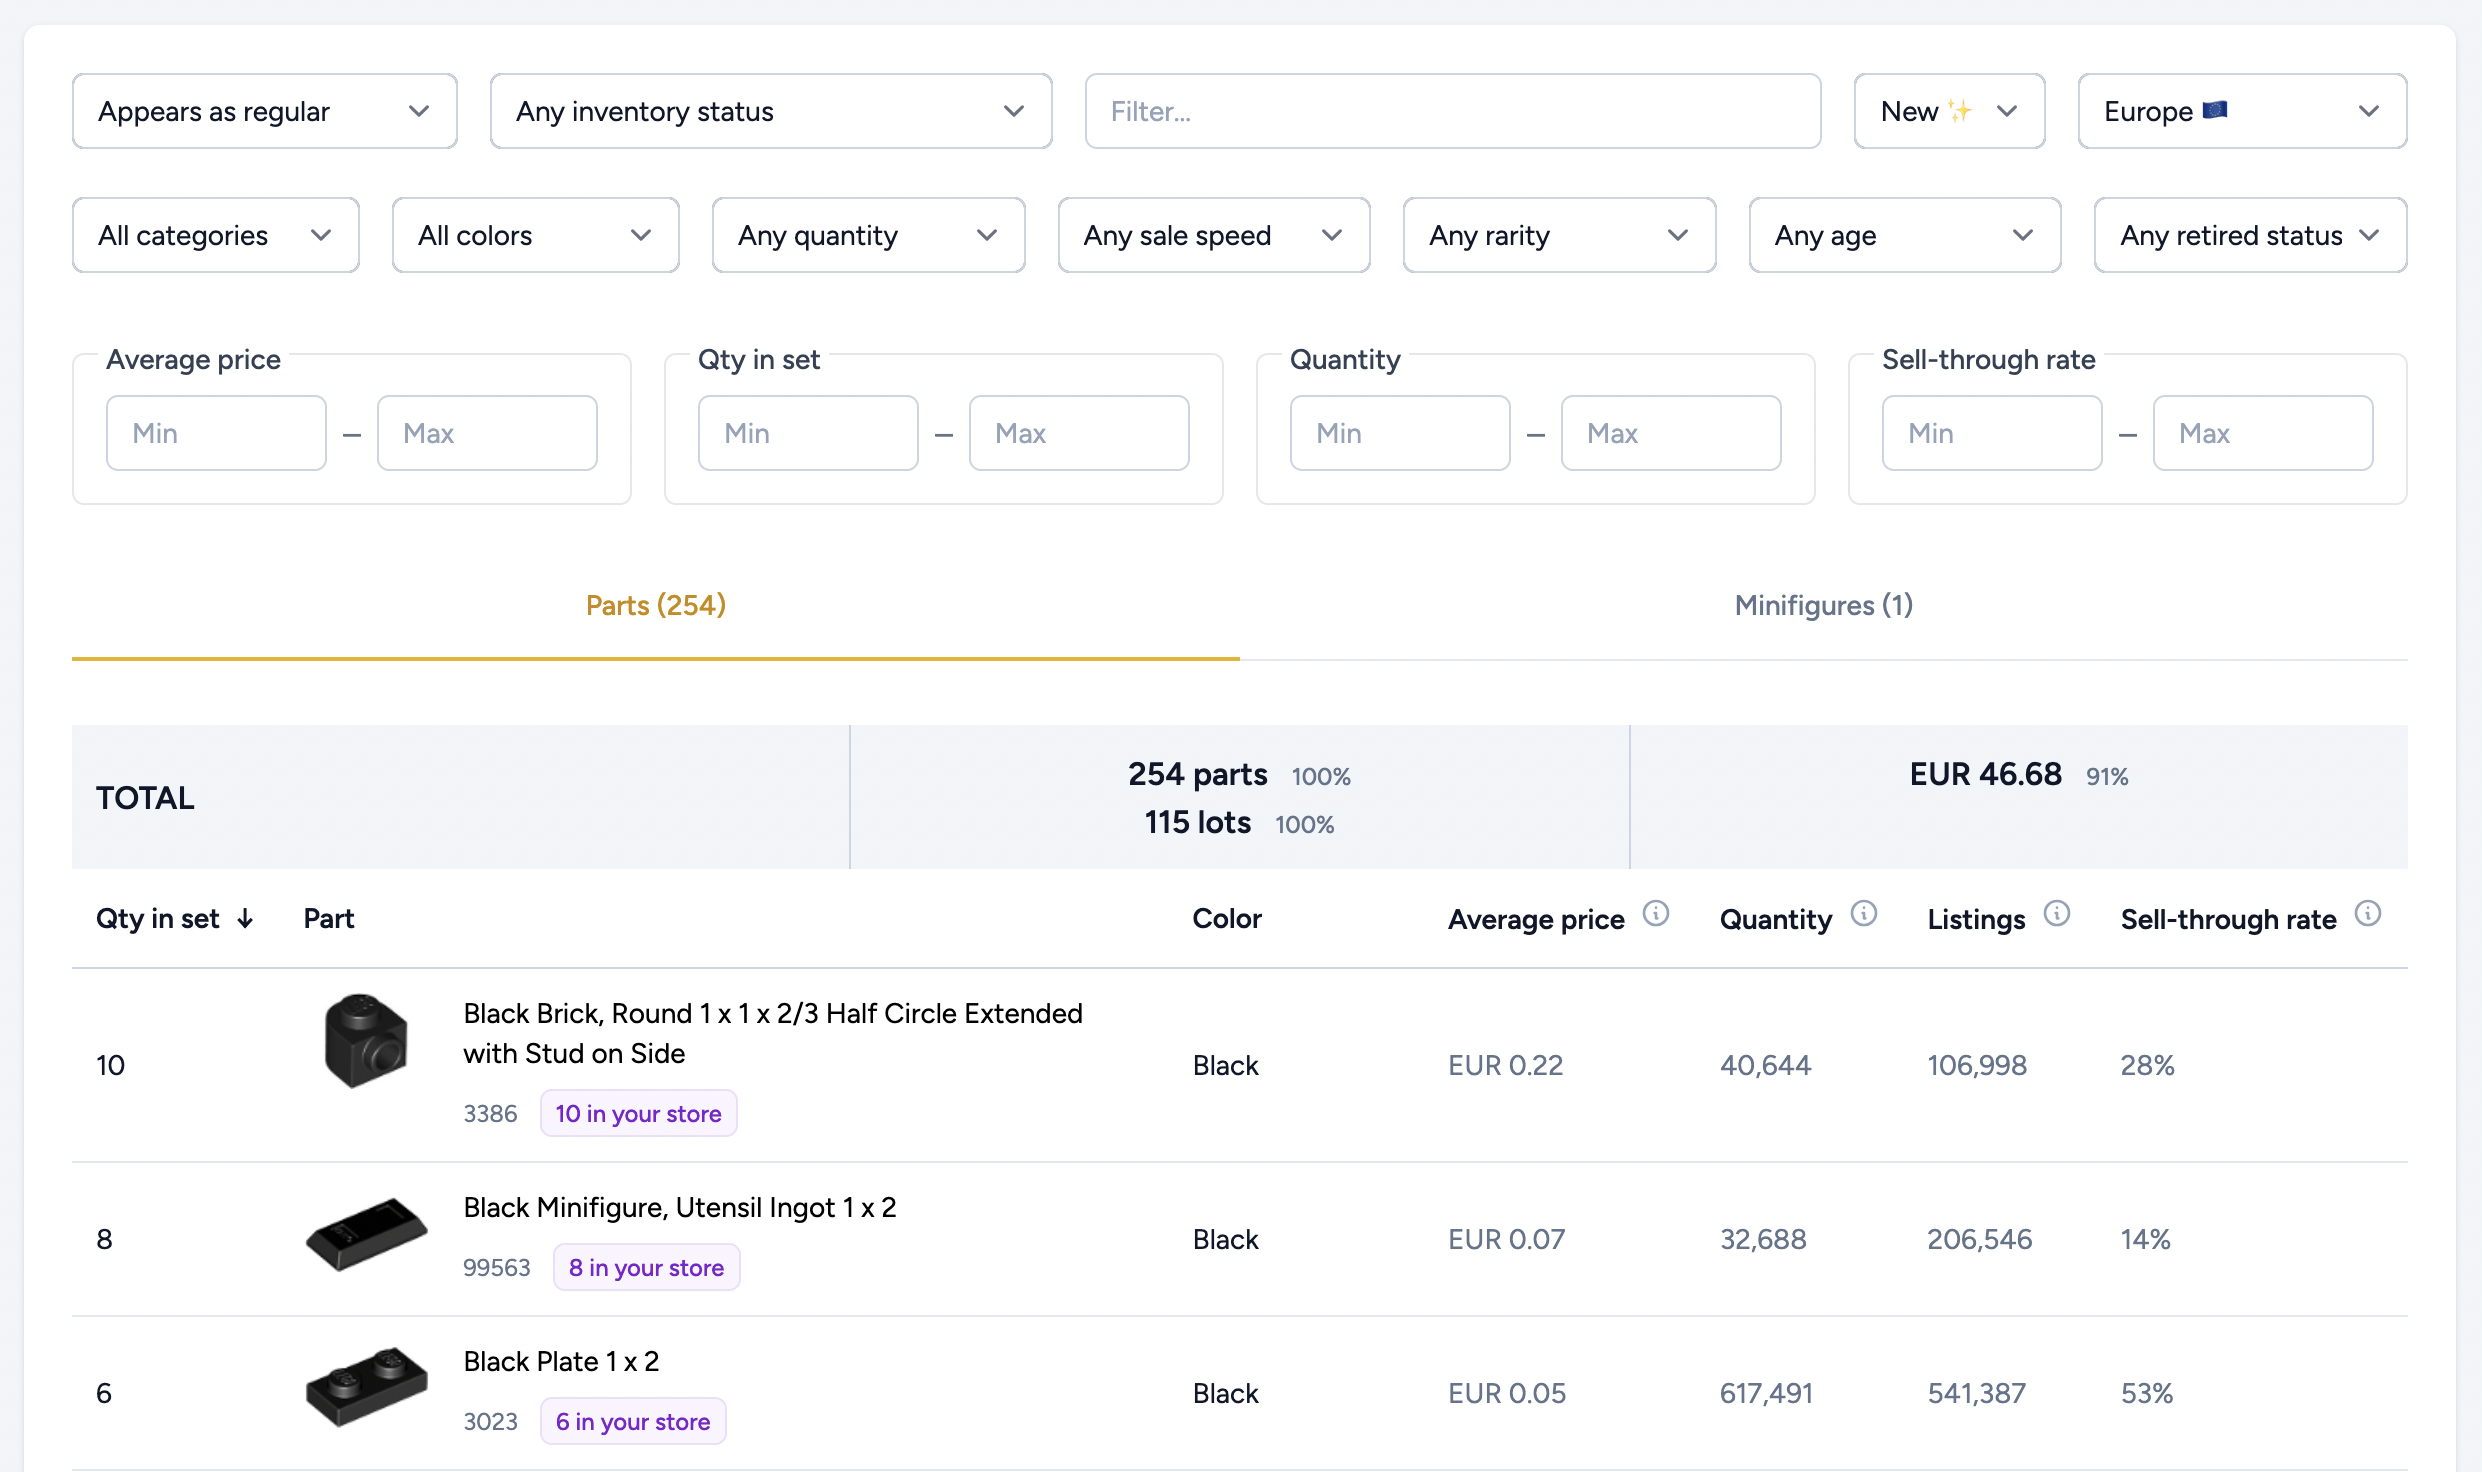
Set Inventory
The set inventory view lets you explore every item included in the set with detailed insights on demand, rarity, pricing, and how it fits into your own store.
For each part or minifigure, you'll see:
- Quantity and part details
- Sales data and demand indicators (e.g. STR, sold quantity, listed quantity)
- Pricing data based on your selected region and condition
- Labels for New (recently released), Retired, Rare (in fewer than 5 sets), or Unique (in only one set)
STR (Sell-Through Rate) measures how quickly an item is selling. It's calculated as: quantity sold in the last 6 months divided by the total available stock (sold last 6 months + currently listed). An STR of 50% means half of the available stock has sold. Higher STR values indicate faster-moving, higher-demand items.
Click on the Table settings at the top right to configure the data to be shown on the table.
You'll also see a small badge next to each part number if the item is already in your store inventory. This helps you quickly spot items that you already stock.
A filter allows you to show only the parts that are already in your inventory, or only those that are not yet in your inventory. This is especially helpful when trying to minimize sorting time or storage expansion, or when you want to expand your lot count.
At the top of the table, you'll find a summary view showing totals for the current filtered results, including total items and lots, and total value. Let's go into more detail about this summary section, as it provides powerful insights for decision-making.

The summary at the top of the inventory table gives you key insights based on the parts currently visible (i.e. after applying any filters). It helps you quickly assess how much of a set's content matches your criteria.
1. Quantity and Lot Count (left column)
Highlighted in red in the screenshot is the total number of parts and lots that match your current filters. In this example, the filter "High Quantity" was applied, which means we're only looking at the top 10% of parts with the highest quantity sold in the selected region.
We can see that this set has 220 parts across 92 lots that meet the "High Quantity" criteria. This example focuses on the parts table, so minifigures are not included. If you switch to the minifigures tab, you'll see the same type of summary applied to filtered minifigs, showing how many match your current view.
Highlighted in green is the percentage of filtered items compared to the full set. In this case, the 220 parts represent 87% of the total number of parts in the set (excluding minifigs), and 80% of the lots.
2. Value Overview (right column)
The second column focuses on value, based on the 6-month average price for your selected region and condition. In this example, the filtered parts are worth €22.37 (highlighted in red).
In green, you'll see the percentage of total value these filtered items represent. Here, the "High Quantity" parts account for 44% of the total set value, which includes minifigures.
3. Why it matters
This summary is extremely useful when combined with filters. It allows you to quickly answer questions like:
- What percentage of the set's value is in minifigures or in specific types of parts?
- How many new lots would this set add to your store?
- What percentage of the parts are fast sellers or slow sellers?
- How many parts are newly released (less than 6 months old)?
- How many parts are of a specific type or color?
- How many parts are unique to this set?
And much more. The summary gives you a clear picture of what's inside the set, and how well it aligns with your store strategy.
Summary
The Sets module gives you everything you need to evaluate part-out opportunities efficiently. With region-based ROI, clear part demand indicators, and integration with your current inventory, you can focus on sourcing the right sets and skip the ones that aren't worth your time.